Donald W. Light | 2012 | Download PDF
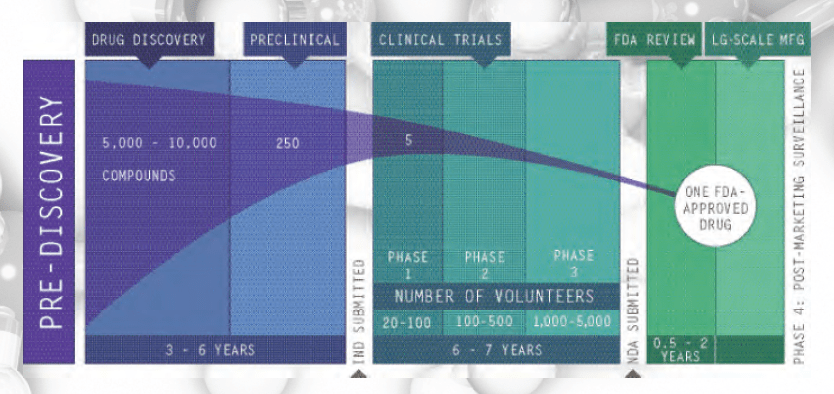
Pharmaceutical R&D refers to the pharmaceutical research and development of new medicines. The process begins with understanding the disease and selecting a target (usually a receptor site on a cell) that can potentially be affected by a drug molecule (Institute of Medicine 2007; PhRMA 2009). Most commonly, researchers use high-speed screening of huge libraries of molecules to identify a few hundred leading compounds, though sometimes they create a molecule or genetically engineer one (PhRMA 2009). In the lab, the leading candidates are tested to see if they absorb, metabolize, and excrete properly, without being too toxic, and to see if they are distributed to the proper site of action. Adjustments are made to improve performance, and candidates are tested both in the lab and in animals before clinical trials begin with humans.
Phase 1 trials measure responses to the drug-candidate in a small number of healthy subjects. Phase 2 trials measure a candidate’s efficacy and short-term side effects in a few hundred subjects, and Phase 3 trials test these attributes in a few thousand subjects. At each phase, companies withdraw candidates that are not performing as expected or whose business prospects make further trials unprofitable. Although these are called “failures,” they are often withdrawals by the company for commercial reasons. Finally, all the data and analyses from trials relevant to review for approval are submitted to the regulator.
This extensive testing arose because pharmaceutical companies put very dangerous drugs on the market without proper testing and explained, “We weren’t told we had to test” (Abraham 1995; Hilts 2003). Finally, in the 1960s they were. Many of the final candidates they propose to market prove too toxic in the trials that are now required. But the bars for efficacy and safety are low. New medicines need only prove they are better than an inert substance, not better than existing medicines. In fact, the companies shaped regulatory rules so that regulators are prohibited from judging how much better a new medicine is than existing ones, and companies can choose narrow criteria for testing and use surrogate or substitute end points for clinical measures of improvement (Hilts 2003). Thus all new medicines are “better” than a placebo; but when independent teams assess how many are better for patients, only 1 in 7 new drugs offers significant advantages, while many have greater risk of adverse side effects (Carpenter et al. 2008; National Institute for Health Care Management 2000; Olson 2004; Prescrire International 2007). This indicates that most R&D is devoted to finding new medicines to replace those going off patent in order to maintain high prices and profits – just as one would expect companies to do when they profit most from finding a variation that can be patented. Nevertheless, 1-2 new drugs a year represent important advances; so over 20 years that’s 20-40 important new drugs.
The bar for safety is low, because companies design trials using patients least likely to have adverse reactions and end trials before many side effects develop; most trials are six months or less. They also often do not report patients in trials who drop out because they cannot stand the side effects. Several other techniques are used to minimize evidence and measurement of adverse effects (Light 2010a). Most of the time, there is little or no advantage to the new product to offset its high risk. Thus the “benefit-risk ratio” (which is actually the benefit-harm ratio) is negative.[1]
Fees from companies pay for most or all of the costs for regulators to assess the safety and efficacy of new medicines, and in return the companies demand short review times as a condition of that funding. The result is that about 1 in 7 new drugs causes serious harm to patients that results in a Black Box warning (the most extreme warning the United States Food and Drug Administration can require) or withdrawal (Lasser et al. 2002), and many more have mild but dysfunctional side effects such as dizziness or sleepiness (Carpenter et al. 2008; Olson 2004). Because the causes of many diseases and how drugs affect them are unclear companies can construct elaborate models about how their products work and widely promote these theories without ever having to provide actual data to justify them. A few examples of this technique are: the notion that depression is caused by low levels of serotonin and the SSRI psychotropic medicines work to raise serotonin levels, that high cholesterol causes heart disease and statins reduce the risk of heart disease by lowering cholesterol or that menopause is a high-risk condition for heart disease and cancer that needs hormone replacement therapy (HRT). When complete and objective data have been gathered using clinical measures, all three of these constructed disease models – and others – have been discredited (Light 2010b; Moynihan and Cassels 2005). Strong incentives to minimize innovation, undetected risks, biased trials, and made-up or exaggerated health risks are some elements of the Risk Proliferation Syndrome that has led to prescription drugs becoming the 4th leading cause of death and a major cause of hospitalization (FDA CDER 2009).
Do high risk and cost justify high prices?
Pharmaceutical R&D is relevant to policy largely as the central justification for high prices and increasing protections from normal price competition that has been an engine of innovation for centuries. In large volume, pills have traditionally cost 8-12 cents apiece (Goozner 2004); so a price of $4.00 is 33-50 times cost, and a price of $8.00 represents a 6667% – 10,000% mark-up. Interestingly, the industry’s price-to-recover-cost argument never shows how quickly the high costs of R&D are recovered. But we do know that British NHS prices are set so that they recover all costs and guarantee a good profit, or else the company can raise its prices until they do (Pharmaceutical Price Regulation Scheme(UK) 2002). Thus, any prices higher than NHS prices (like US prices) are excessively high to generate excessively high profits. The pharmaceutical industry puts it the other way around, namely that US prices are needed to recover high R&D costs and European prices do not. It has carried out a concerted campaign to claim that Europeans (not to mention countries that pay less) are “free riders” on U.S. citizens. This mythic claim makes no logical sense – should a new drug discovered in Switzerland or the UK be paid for only from sales from Switzerland or the UK? – and it is not supported by company and government data (Light and Lexchin 2005).
Protections, such as patents or data exclusivity, work only if they are temporary periods for recovering R&D costs and followed by the pressure of price competition to innovate again. By contrast, long protections generate monopolistic behaviors like the extensive strategies of companies to pay competing companies to keep their products off the market and to initiate anti-competitive legal actions that were documented by the European Commission on Competition (2008 (Nov 28)).
The industry claims that “Only one of every 10,000 potential medicines investigated…makes it through the research and development pipeline…” and “The average cost…is $800 million to $1 billion” (PhRMA 2009) (http://www.phrma.org/innovation). This implies companies make huge bets on long shots when in fact most of the cost occurs at the end of development in trials, when the risk is 1 in 5 or less. Further, the $0.8-1.0 billion cost estimate is based on assumptions and multiplications by industry-supported economists that do not stand up to independent assessment. Let us break this account down into R(esearch) and D(evelopment).
R differs greatly from D. R refers to the basic research to discover disease targets and possible medicines to affect them, while D refers to testing the short list of final candidates. The 1 in 10,000 could just as easily use the size of the library of molecules screened to declare that only 1 in 1,000,000 make it to market. The risk figure is mythic, not empirical, and either way, the early high-risk screening does not cost much. Moreover, much of R(esearch) is funded by public sources and is a free ride for companies; yet they include it in their high estimates and multiply it so that it constitutes a third of the $0.8-$1.0 billion (DiMasi et al. 2003).[2] In fact, 84.2% of all funds for discovering new medicines come from public sources (Light 2006). R(esearch) can vary from 3 months to 30 years, from discovering Viagra as a side effect of a cardiac drug, to years of frustrating basic research, dead ends, and failed results, until finally various teams put the pieces together (Goozner 2004). No one has made an estimate of the cost of basic research per new medicine, and it is unclear how one would do it. How far back would one go, and how would one allocate research costs on work that affects many drugs? Based on self-reports by companies, the National Science Foundation estimated that 18 percent of company R&D went to basic research, and the trade association estimated it as 9.3 percent (Pharmaceutical Research and Manufacturers of America 2002: table 5). If one assumes that 18 percent of sales goes to R&D, a generous figure claimed by the industry, then only 1.8-3.2 percent of sales goes to discovering new medicines. Taypayers’ subsidies through tax credits and deductions are about 35-39 percent; so the net corporate investment in basic research to discover “tomorrow’s life-saving drugs” is only about 1.2 – 2.1 percent of sales (Light and Lexchin 2005).
D(evelopment) is much more routine than R, though the size and length of trials can vary a lot. But the industry’s $0.8-$1.0 billion estimate is based on a non-random, small sample of companies and on the most costly 21 percent of medicines, using variable costs reported in secret by companies to their leading policy research center, where only the supported economists can see the data (Light and Warburton 2005). Averages are used when medians should be, because a few expensive cases pull up the average. The actual R&D costs reported by the companies averaged only $87 million for these costly drugs, and even they may be inflated; so the $800 million estimate results from the economists developing methods to inflate $87 million to $800 million. One way was to back in a generous amount for basic research because companies submitted no cost for basic research. Another way was to maximize the cost of “failures” or withdrawals. A third way was to multiply these figures by the “cost of capital” over the many years.
The cost of capital mean, in plain English, the money a company would have made had it not invested in the project but instead put its money into government bonds or stocks. It is the “presumed, foregone profits” rebadged as “costs.” Cost of capital does not mean the cost of borrowing capital, like monthly interest on a loan. Industry-supported economists assume companies would have made 11% a year, much higher than the long-term return on equities or the cost of borrowing the money. This high presumed profit rate is then called a “cost” and accounts for more than half the total R&D estimate of $0.8-$1.0 billion. While cost of capital is a legitimate tool for judging whether a project is worth investing in – will it make more money than simply investing it? – using it as a claim against society changes its use entirely to saying, “You owe us a billion dollars because we invested this money to discover a new drug to benefit you.” Thus there are good reasons for not including this presumed profit as part of R&D cost, and a distinguished international board recently concluded it should not be included (Moran et al. 2009 (Feb)).
In conclusion, what matters to companies is the net, median, corporate cost of R&D, not the gross, societal cost, and it is a fraction of the amount claimed, about 10-16 percent of the $0.8-$1.0 billion. Most of these new medicines have few or no advantages over existing ones to offset their higher risks, which have led to medicines becoming a leading source of illness, injury and death. A few key changes could greatly improve this situation. First, the benchmark for approval should be clinical superiority to existing drugs. Second, the costly trials should be funded by the public and run independently. Third, the regulatory agencies need to be independent of industry funding and influence too. Medicines are a vital social good, not a commodity to be sold like candy. Health Action International puts it well when it says that all medicines developed and marketed “should meet real medical needs; have therapeutic advantages; be acceptably safe and offer value for money” (HAI 2009 (April 12)).
Pharmaceutical Industry’s Account of Risk and Years to Develop a New Drug
Most Funds for Basic Research to Discover New Drugs come from Taxpayers Re-framing the 10/90 Report In U.S. 2004 dollars. For assumptions, see notes and text.
| Total R&D1 | Basic Research Funds For Breakthrough Drugs | Percent Basic Research Funds by Source | |
| Governmental & Public Programs | $46.6 billion | $41.5 billion4 | 78.7% |
| Foundation & non-profit sources | $8.1 billion | $2.0 billion4 | 3.8% |
| Pharmaceutical & Biotech Corporations: | |||
| Gross Reported 2 | $51.2 billion | $9.2 billion | 17.5% |
| Taxpayers’ Subsidies3 | $15.9 billion | $2.9 billion 5 | 5.5% |
| Net Corporate Funds | $35.3 billion | $6.3 billion 5 | 12.0% |
| Totals | $105.9 billion | $52.7 billion | 84.2% public 12.0% industry 3.8% foundations |
Notes:
- Based on 2004 Global Health Forum report., Monitoring Financial Flows for Health Research and Light 2006.
- Unverified but believed by reviewers to include substantial costs not normally considered to be part of research and development, as explained in the text.
- Based on 31% average for tax deductions and credits. May be low. Does not include large overseas US profits taxed at 4% instead of 35%.
- Based on 89% for basic research in public contributions and 25% in foundation & non-profit contributions.
- Based on NSF data showing 18% of pharmaceutical R&D used for basic research. Other estimates suggest higher and lower percentages.
For Further Reading: The pharmaceutical industry websites, such as the one cited, have good descriptions of the R&D process, though with the emphasis discussed here on the highest risk and greatest cost. A more impartial description is provided in the IOM report cited. The industry’s view and estimate of costs is well represented by the DiMasi et al. citation. Readers will find many other studies and reports on the website of the industry’s leading policy center, at Tufts University, the Center for the Study of Drug Development. csdd.tufts.edu/ PharmedOut is an independent watchdog organization, at www.pharmedout.org/, and NoFreeLunch is as well www.nofreelunch.org/aboutus.htm. The Health Research Group at Public Citizen has the longest, strongest track record of informed, independent assessments of the pharmaceutical industry, at www.citizen.org/hrg/. John Abraham is a leading authority on the industry, its myths and its realities. His excellent work is at www.sussex.ac.uk/sociology/profile6.html.
References
Abraham, John. 1995. Science, Politics and the Pharmaceutical Industry. London: Routledge.
Carpenter, Daniel, Evan James Zucker and Jerry Avorn. 2008. “Drug-review deadlines and safety problems.” New England Journal of Medicine 358:1354-1361 (1359:1396-1398).
DiMasi, Joseph A., Ronald W. Hansen and Henry Grabowski. 2003. “The price of innovation: new estimates of drug development costs.” Journal Of Health Economics 22:151-185.
European Commission for Competition. 2008 (Nov 28). “Pharmaceutical Sector Inquiry – Preliminary Report “. Brussels: European Commission for Competition.
FDA CDER. 2009. “Preventable adverse drug reactions a focus on drug interactions.” Washington DC: U.S. Food and Drug Administration, Center for Drug Evaluation and Research.
Goozner, Merrill. 2004. The $800 Million Pill: The Truth Behind the Cost of New Drugs. Berkeley: University of California Press.
HAI. 2009 (April 12). “Responses to the Expert Working Group on Alternative Financing.” Amsterdam: Health Action International.
Hilts, Phillip J. 2003. Protecting America’s Health: The FDA, Business and One Hundred Years of Regulation. New York: Alfred A. Knopf.
Institute of Medicine. 2007. The Future of Drug Safety: promoting and protecting the health of the public. Washington DC: National Academy Press.
Lasser, Karen E., Paul D. Allen, Steffie J. Woolhandler, David U. Himmelstein and et al. 2002. “Timing of new black box warnings and withdrawals for prescription medications.” Journal of American Medical Association 287:2215-2220.
Light, Donald W. 2006. “Basic Research Funds to Discover Important New Drugs: Who Contributes How Much?” In Monitoring the Financial Flows for Health Research 2005:Behind the Global Numbers, ed. Mary Anne Burke. Geneva: Global Forum for Health Research.
Light, Donald W. 2010a. “Bearing the Risks of Prescription Drugs.” In The Risks of Prescription Drugs, ed. D.W. Light. New York: Columbia University Press.
Light, Donald W. ed. 2010b. The Risks of Prescription Drugs. New York: Columbia University Press.
Light, Donald W. and Joel Lexchin. 2005. “Foreign free riders and the high price of US medicines.” BMJ 331:958-960.
Light, Donald W. and Rebecca N. Warburton. 2005. “Extraordinary claims require extraordinary evidence.” Journal of Health Economics 24:1030-1033.
Moran, Mary, Javier Guzman, Anne-Laure Ropars and et al. 2009 (Feb). “Neglected disease research and development: how much are we really spending?” PLoS Medicine 6(2):0136-0146.
Moynihan, Ray and Alan Cassels. 2005. Selling Sickness: How the World’s Biggest Pharmaceutical Companies Are Turning Us All Into Patients. New York: Nation Books.
National Institute for Health Care Management. 2000. “Prescription Drugs and Intellectual Property Protection.” Washington D.C.: National Institute for Health Care Management.
Olson, Mary K. 2004. “Are novel drugs more risky for patients than less novel drugs? .” Journal of Health Economics 23:1135-1158
Pharmaceutical Price Regulation Scheme(UK). 2002. “Sixth Report to Parliament.” London: PPRS.
Pharmaceutical Research and Manufacturers of America. 2002. “Pharmaceutical Industry Profile 2002.” Washington DC: Pharmaceutical Research and Manufacturers of America.
PhRMA. 2009. “Drug Discovery and Development: Understanding the R&D Process.” Washington DC: Pharmaceutical Research and Manufacturers of America.
Prescrire International. 2007.
“1981-2006: 26 years of drug awards ” Prescrire International
16(88):77-79.
[1] The ratio is the risk of benefit versus the risk of harm; so to say “the risk-benefit ratio” is nonsense, or a fudge to hide what the “risk” is, namely toxic reactions to drugs. We should say harm-benefit ratio, not risk-benefit ratio.
[2] Actually, the same industry-sponsored team has increased its estimate to $1.3 billion, and by the time one reads this, it will be higher.